Ready to take your operations to the next level in 2024? Explore the top 8 AIOps tools for success.
The post Top 8 AIOps Tools for 2024 appeared first on eWEEK.
Artificial intelligence for IT operations (AIOps) is an emerging technology that combines artificial intelligence and big data to automate many IT operation processes, including event correlation, anomaly detection, and causality determination.
Since 2016 when the technology was first developed, many IT solution companies have created their own version of AIOps software to improve and optimize IT operations. While no two tools are the same, some are more beneficial for certain organizations than others. Here are our top selections for today’s best AIOps software.
See how the best AIOps software compares in terms of features and pricing.
| Free Trial | Key Feature | Ease of Use | Starting Price | |
|---|---|---|---|---|
| Freshservice | 14-day free trial | Incident management | Low learning curve | $29 per agent per month |
| ManageEngine OpManager Plus | 30-day free trial | Automated remediation and topology mapping | Moderate | Available upon request |
| Datadog | 14-day free trial | Predictive forecast | Steep learning curve | Available upon request |
| AppDynamics | 15-day free trial | Intelligent root cause analysis | Moderate | $6 per month per CPU Core |
| BigPanda | Request a demo | Alert intelligence | Moderate | Available upon request |
| Instana | 14-day free trial | API and APM monitoring | Moderate | Starts at $20 |
| Splunk Enterprise | 60-day free trial | Synthetic API, browser, and uptime monitoring | Steep learning curve | Starts at $15 per host per month, billed annually |
| Dynatrace | 15-day free trial | End-to-end infrastructure observability | Moderate | Starts at $0.001 per synthetic request |
![]()
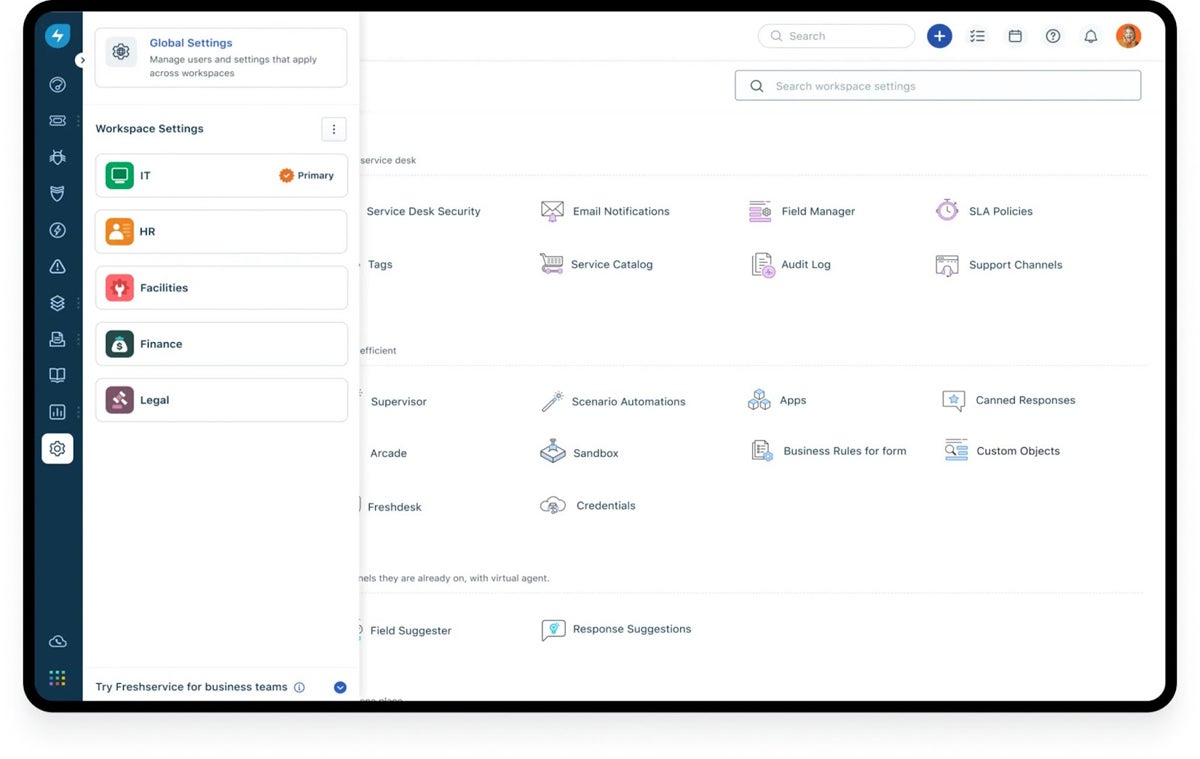
Freshservice offers an AI-driven IT operations management solution, enabling IT teams to automate routine tasks and workflows, categorize and prioritize incidents, and provide actionable insights for faster problem resolution. Most important for companies on a tight budget: Our research found that Freshservice costs less than some of its competitors, making it one of the most affordable tools on our list.
The platform’s core feature is its automated grouping. It uses the Freshservice AI engine, Freddy, to improve incident context and reduce the Mean Time to Resolve (MTTR) by correlating alert patterns and associating relevant alerts with open incidents. Freshservice’s solution helps companies eliminate duplicate incidents, enhance incident context in real time, and make it easier for IT teams to identify and solve the root causes of issues.
| Pros | Cons |
|---|---|
| Knowledge recycling and root cause identification | Some users say the asset interface can be improved |
| Smart alerts and notifications | The alert management capability can be improved |
A 14-day free trial is available. Pro and Enterprise plan users can also include Freddy Copilot as an add-on at an additional cost of $35 per agent per month when billed monthly, or $29 per agent per month when billed annually.
To learn more about optimizing your AIOps deployment, see our guide, AIOps Best Practices
![]()
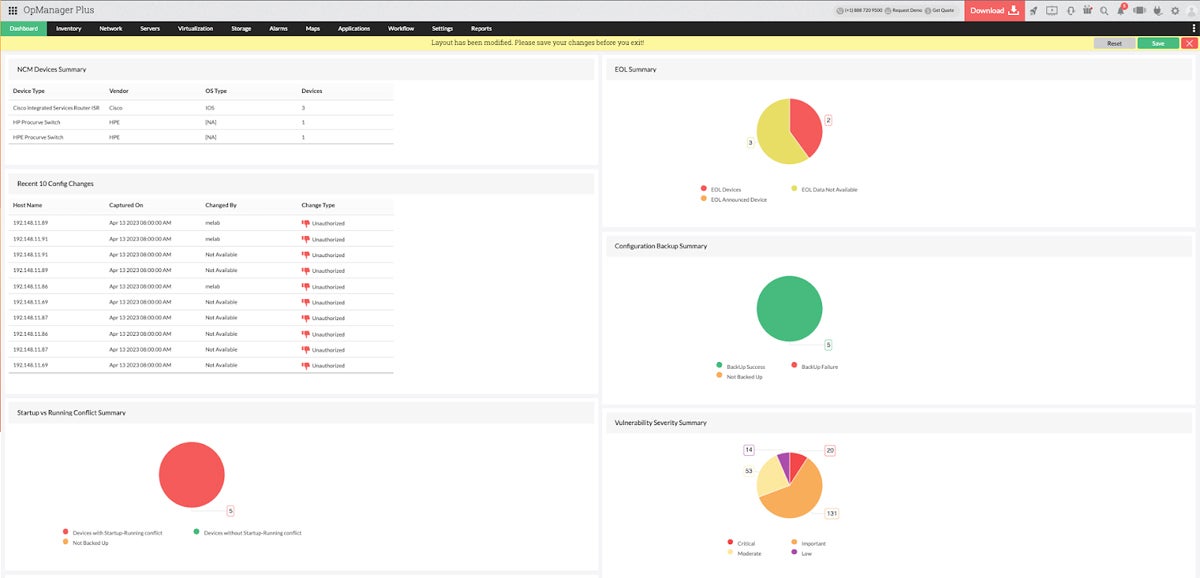
OpManager Plus is an advanced AI- and ML-based IT operation management solution offered by ManageEngine. It provides comprehensive data gathering and processing capabilities for ITOps teams.
The solution gives AI- and ML-based alerts through automated threshold configuration for critical performance metrics. This allows network administrators to monitor the performance metrics of various devices intently.
OpManager Plus also facilitates cross-domain correlation of collected data, allowing IT operations teams to identify relationships and causality. This helps in understanding and handling issues quickly, as well as improving event management efforts and analysis of metrics such as false-positive rates and signal-to-noise ratios.
| Pros | Cons |
|---|---|
| Real-time notifications help reduce MTTR | Lacks transparent pricing |
| Monitor the performance of applications | Complex initial setup |
ManageEngine requires potential users of their OpManager Plus solution to contact them for a custom quote.
![]()
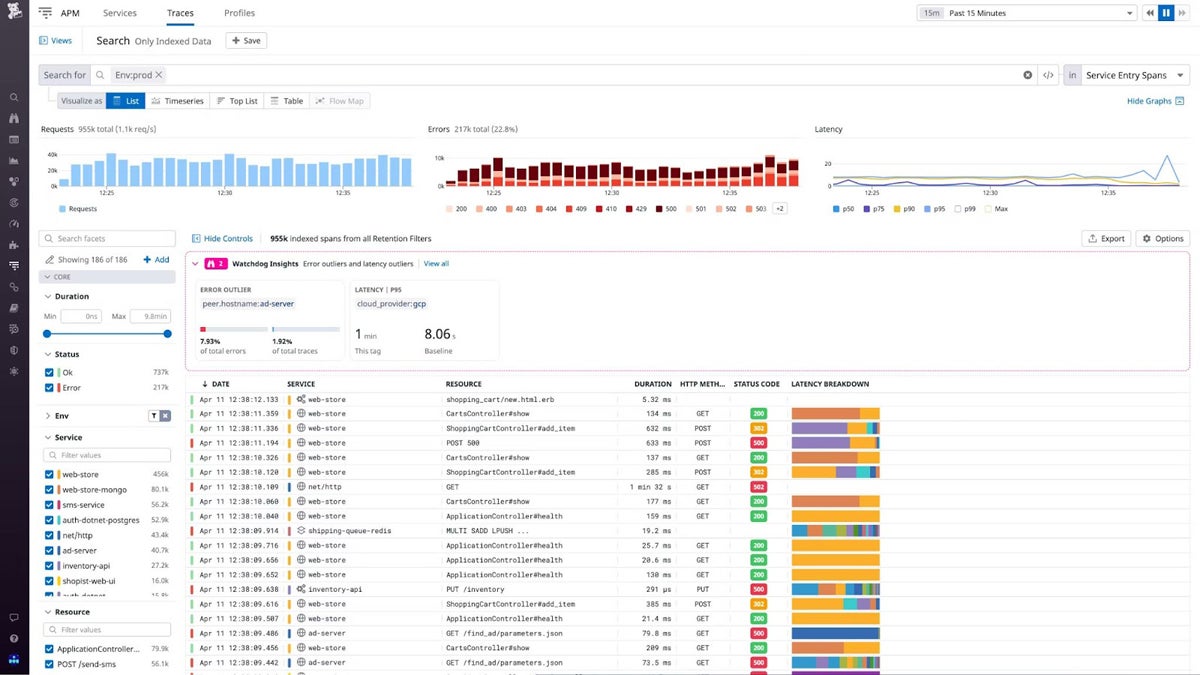
Watchdog is Datadog’s AI engine that continuously analyzes data from various sources, such as infrastructure monitoring, application performance monitoring (APM), log management, and real user monitoring (RUM). This AI engine automatically detects performance anomalies, identifies spikes and drops in critical health indicators, surfaces concerning patterns and outliers in log data, and helps prevent large-scale failures with automatic code version comparison.
The platform provides automated alerts, insights, and root cause analyses to help you resolve issues more quickly and proactively address latency and errors before they impact your end users. For those companies for which rapid response is a top priority, Datadog is a candidate worth considering.
| Pros | Cons |
|---|---|
| Automatic correlation to immediately identify potential root causes | Steep learning curve |
| Offers over 700 integrations | Support can be better |
Datadog doesn’t advertise the price of Watchdog on their page. They request potential buyers to contact them for a custom quote. Our research found that Watchdog’s core features are available in Datadog’s infrastructure monitoring, APM, log management, and RUM solutions.
The infrastructure monitoring solution pricing starts at $18 per host per month. Log management starts at $0.10 per ingested or scanned GB per month. APM starts at $36 per host per month, and RUM starts at $1.50 per 1,000 sessions per month.
Before buying the tool, you can use the 14-day free trial.
![]()
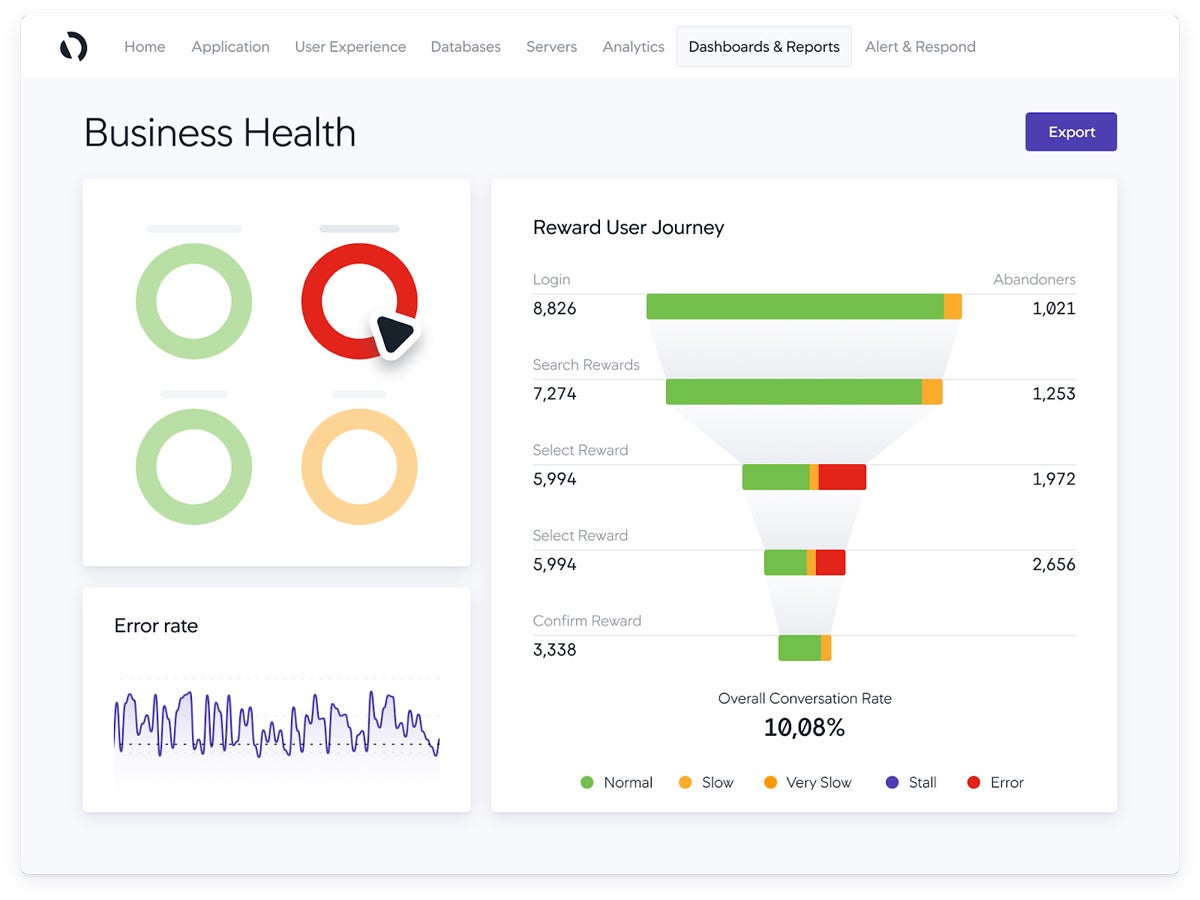
Featuring application performance monitoring, infrastructure monitoring, business performance monitoring, and analytics, AppDynamics is an AIOps solution that offers APM and observability, which makes this product a strong contender for companies that focus on constantly monitoring their applications. It provides real-time insights into the performance and behavior of applications and infrastructure to identify and resolve issues and optimize performance.
AppDynamics offers a complete suite of business-focused analytics, dashboards, reporting, and alerts for business users and IT professionals, all of which work together to provide real-time insights into applications’ health, performance, and availability.
| Pros | Cons |
|---|---|
| Powerful analytics for capacity planning | User interface can be better |
| Feature-rich | Sometimes slow |
![]()
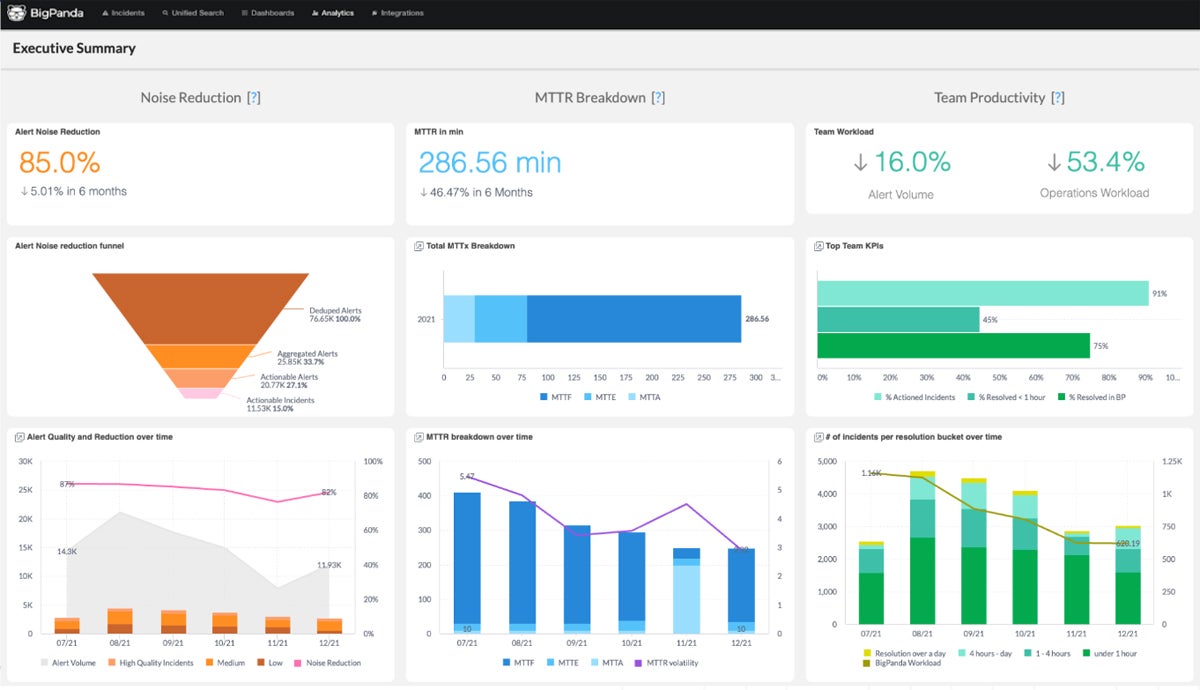
BigPanda’s advanced AI capabilities make it a top choice for organizations seeking AIOps analytics solutions.
BigPanda helps IT Ops, NOC, and DevOps teams detect, investigate, and resolve IT incidents quickly. The platform uses AI and ML algorithms to automatically consolidate and correlate alerts, events, and topology data from various monitoring and observability tools. Doing so reduces alert noise, creates a unified incident timeline, and provides context-rich insights to enable faster incident response and management processes.
In addition to incident response automation, BigPanda also excels in correlating data from various sources. It integrates information from monitoring, topology, and change tools, generating actionable insights. By consolidating data from these different tools, BigPanda provides a comprehensive view of the IT environment, helping organizations better understand the impact of incidents and changes.
| Pros | Cons |
|---|---|
| Easy-to-integrate API connectors | Customer support can be improved |
| Noise reduction capability and Ops-Aware inbox that lets you keep all alerts organized and updated | The dashboard element of the tool can be improved |
The company doesn’t advertise its rates on its website. Customers must contact their sales team to get a quote.
![]()
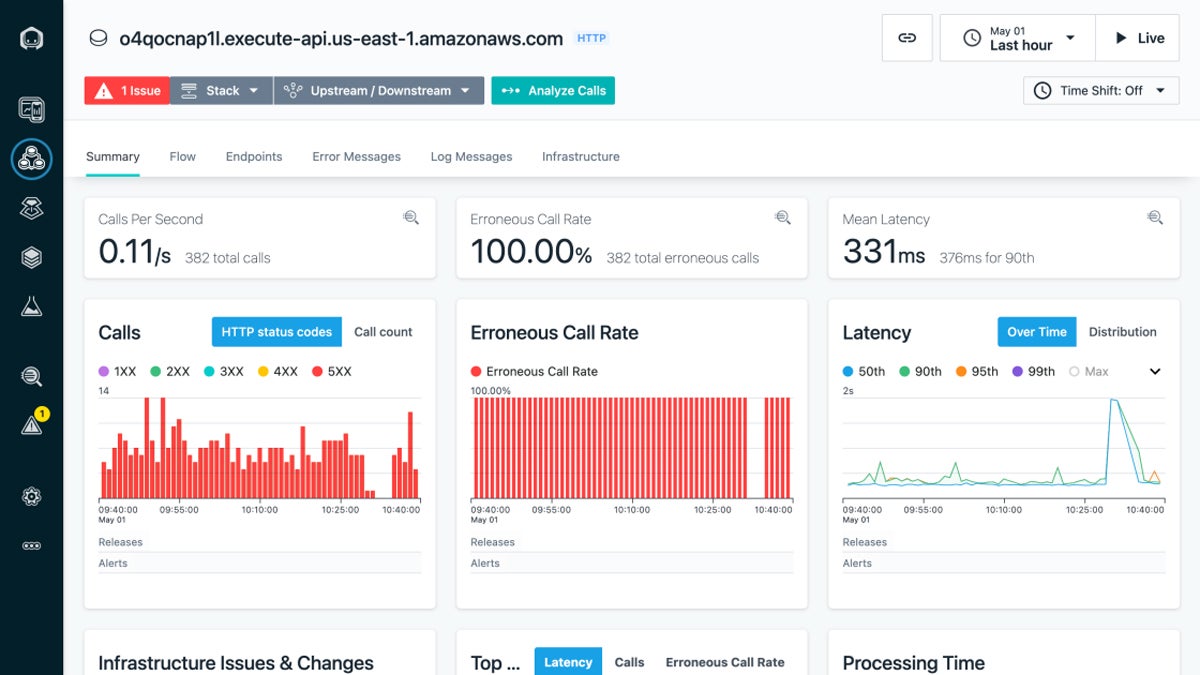
Powered by automated APM, IBM’s Instana Observability is a full-stack AIOps tool that enables developers and operations teams to monitor and manage their applications and infrastructure performance. Significantly, it provides real-time insights into the health and performance of applications, microservices, and cloud environments, which is a complex environment for any solution to monitor.
Instana collects and analyzes metrics, logs, and traces to provide a holistic view of system performance and health. This holistic view helps admins make sense of a mixed IT system that may or may not integrate seamlessly.
The tool monitors the underlying infrastructure, including servers, containers, and cloud services, to identify performance bottlenecks or resource issues. Instana integrates with over 300 tools, including other monitoring tools like log management and network monitoring tools.
| Pros | Cons |
|---|---|
| Real-time insights that allow for rapid detection and resolution of issues | Initial complexity may be time-consuming |
| AI-powered anomaly detection helps detect anomalies early | Expensive |
A 14-day free trial is available.
![]()
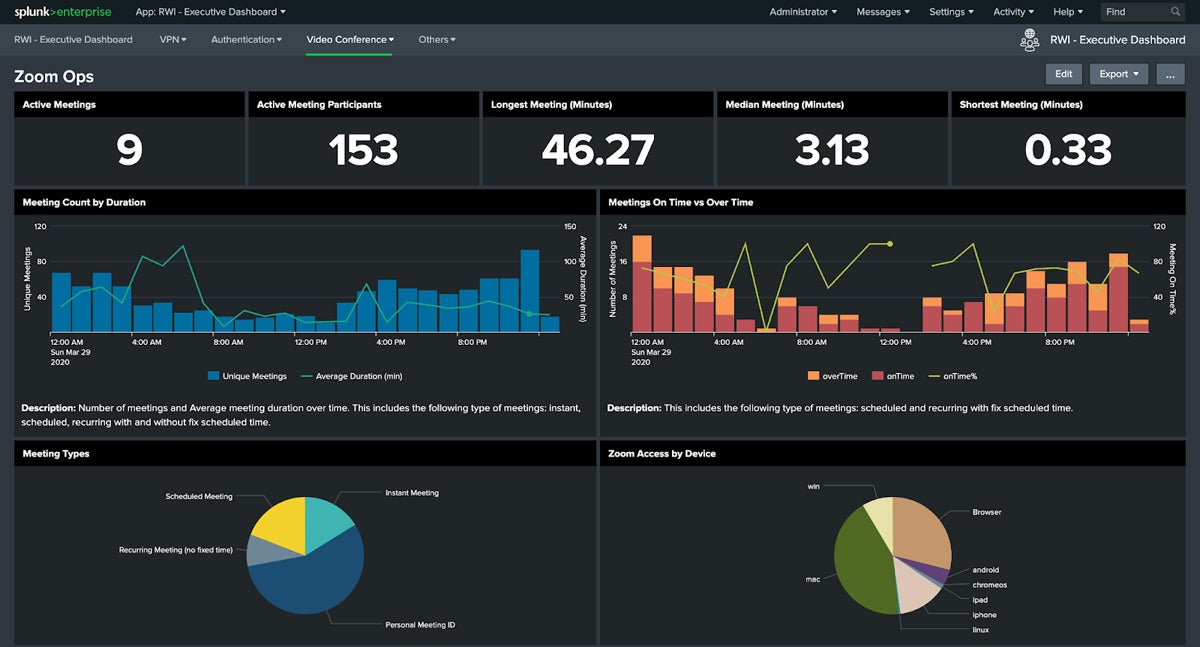
The Splunk Enterprise platform, which Splunk AI powers, combines security and observability, helping it detect, investigate, and respond to complex threats. It provides a centralized platform for monitoring, searching, analyzing, and visualizing data from various sources, including applications, servers, networks, and sensors. With a mature offering in the log analysis sector, this Splunk solution is highly attuned to detect anomalies – which is necessary for strong security.
Splunk Enterprise can ingest data from multiple sources, including logs, metrics, events, and traces. It then indexes the ingested data in real time, enabling fast and efficient search capabilities across large datasets.
The company also provides tools for advanced analytics and visualization, allowing users to gain insights from their data through dashboards, reports, and data visualizations.
| Pros | Cons |
|---|---|
| Provides end-to-end visibility of every user session on the web and mobile | Cost can be a barrier for small businesses |
| No-code debugging using Splunk logs | Steep learning curve |
You can try the tool at no cost for 60 days as a hybrid or on-prem download.
Splunk observability pricing:
![]()
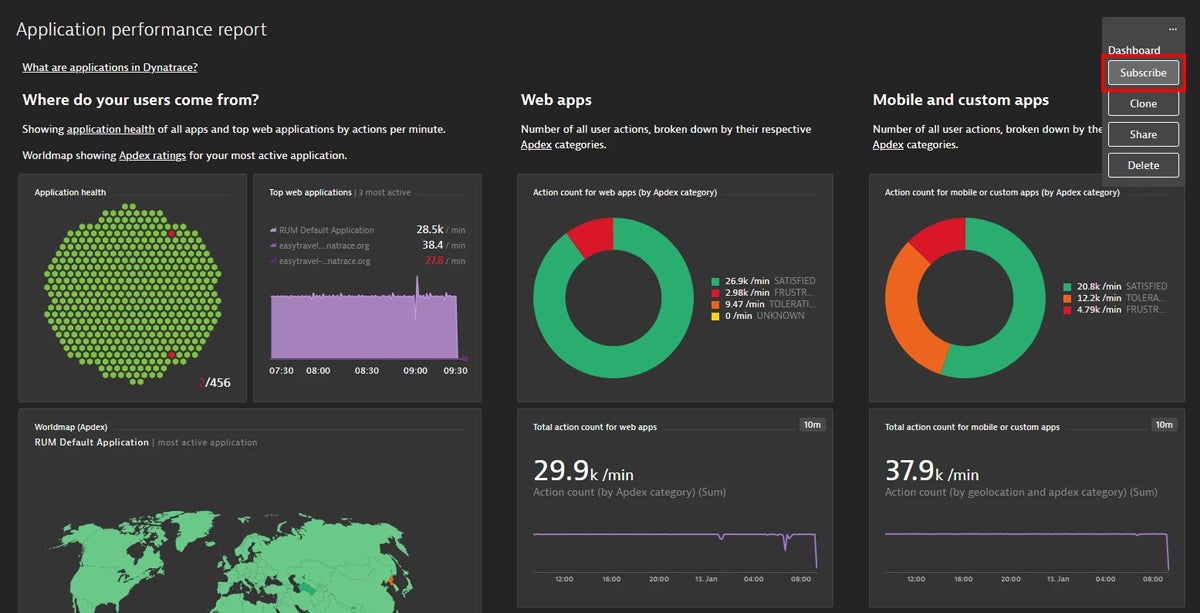
Our analysis found that Dynatrace provides comprehensive AI-supported monitoring and analytics capabilities for applications, microservices, and infrastructure in dynamic, cloud-native environments. Due to the complexity of this task, the AI analytics is now largely essential – attempting this level of monitoring with only human IT staff would be challenging at best.
Dynatrace offers an all-in-one platform for monitoring and managing IT infrastructure, applications, and user experience. It leverages AI and ML to automatically detect and analyze anomalies and provide insights and recommendations for optimizing performance and resolving issues.
Its core strengths include APM, infrastructure monitoring, digital experience monitoring (DEM), cloud monitoring, and Kubernetes monitoring.
| Pros | Cons |
|---|---|
| Feature-rich and integrates with over 650 third-party apps | Support can be improved |
| Full-stack observability | Expensive pricing |
A 15-day free trial is available.
To select the best AIOps software for your company, you must first discover the pain points in your IT operations that you want the AIOps software to address. This could be anything from the need for faster incident resolution to proactive problem detection and prevention.
Selection must be done based on what is important to you. Looking for a moderately priced AIOps tool? Our analysis found that Freshservice’s solution is inexpensive compared to that of some competitors. Organizations with a low tolerance for downtime may find OpManager Plus and AppDynamics monitoring and proactive alerts beneficial.
Datadog’s Watchdog and Dynatrace are known for their real-time monitoring and troubleshooting capabilities, making them ideal for companies that prioritize timely issue resolution.
We recommend choosing a tool that offers the most relevant features and capabilities to address your core IT infrastructure challenges – in the most economical manner.
We answered the most commonly asked questions about AIOps software to help you learn more about the solution and discover how it can serve your IT needs.
There is no single overall best AIOps platform, as the best software for an organization depends on its specific needs, goals, and requirements.
Some common use cases for AIOps include:
AIOps improves efficiency by automating monotonous and manual tasks such as monitoring, event analysis, and incident resolution. It also provides proactive incident management and faster time to resolution, ultimately reducing downtime, enhancing customer experience, and improving overall service quality.
Medium and large organizations are fast adopting AIOps because of its benefits to their ITOps and IT service management processes. AIOps software enables IT teams to detect, analyze, and resolve incidents with far less effort.
This leads to improved operational performance, faster problem resolution, proactive incident management, better resource allocation, and enhanced customer experiences. In sum, AIOps is an important emerging technology that uses artificial intelligence to manage the growing complexity of today’s IT infrastructure.
For a full portrait of the AI vendors serving a wide array of business needs, read our in-depth guide: 150+ Top AI Companies 2024
The post Top 8 AIOps Tools for 2024 appeared first on eWEEK.